

Neal’s trends talk
Where the market is heading
The latest Real Estate Trends webinar from Neal Bawa, free to replay.

August 2026
2026 Mid Year Real Estate Trends
Neal Bawa, the Mad Scientist of Multifamily, walks through where the economy, interest rates, rents and home prices are heading, and what it means for investors.
Watch the replayMarket pulse
The numbers that matter in 2026
National indicators for apartments, single-family homes, rates and the economy.
Apartments & rentals
Rental vacancy rate
as of Q3 2026
▲ up 0.5 points from a year ago
Rent inflation (CPI rent of primary residence, yearly change)
as of September 2026
▼ down 0.6 points from a year ago
Apartment starts (5+ units, annual rate)
as of September 2026
▼ down 25.9% from a year ago
Apartment completions (5+ units, annual rate)
as of September 2026
▼ down 20.4% from a year ago
Apartments under construction (5+ units)
as of September 2026
▼ down 3.1% from a year ago
Single-family homes
Single-family starts (annual rate)
as of September 2026
▲ up 2.6% from a year ago
Home prices (FHFA purchase-only index, yearly change)
as of August 2026
▼ down 0.3 points from a year ago
Median price of new homes sold
as of September 2026
▼ down 3.9% from a year ago
Months' supply of new homes
as of September 2026
▲ up 0.2 months from a year ago
Homeownership rate
as of Q3 2026
▲ up 0.2 points from a year ago
Rates & economy
30-year mortgage rate
as of October 2026
▲ up 1.1 points from a year ago
10-year Treasury yield
as of September 2026
▲ up 0.9 points from a year ago
Fed funds rate
as of September 2026
▼ down 0.5 points from a year ago
Unemployment rate
as of September 2026
▼ down 0.2 points from a year ago
Updated November 2, 2026. Data: U.S. Census Bureau, Bureau of Labor Statistics, FHFA, Freddie Mac and Federal Reserve, via FRED (Federal Reserve Bank of St. Louis).
Market reports
What the research says
Summaries of recent reports — follow through to the publishers for the full documents.
Weekly Mortgage Rates Ease to Monthly Low
as of October 2026
National mortgage rates fell slightly across the board, providing prospective homebuyers with a modest increase in affordability. The average 30-year fixed-rate mortgage retreated to 7.24%, down from 7.32% the previous week but up significantly from 6.17% one year earlier. Concurrently, the average 15-year fixed loan slipped to 6.60% from 6.68% a week prior, compared to 5.41% at the same time last year. This marked the lowest borrowing cost seen so far this month.
Read the full report →U.S. Housing Starts and Permits Drop in September 2026
as of October 2026
U.S. home construction activity cooled across several key measures heading into the fall. Total housing starts fell 5.2 percent from the prior month to a seasonally adjusted annual pace of 1,221,000 units. Building permits also slipped 0.2 percent to an annualized rate of 1,400,000, driven down by single-family authorizations falling 4.0 percent. Meanwhile, residential completions edged up 2.2 percent to 1,192,000 units, though they remained 14.0 percent below the pace recorded a year earlier.
Read the full report →Builder Sentiment Drops as Price Cuts Reach Multi-Year High
as of October 2026
Builder sentiment for new single-family homes slipped three points to 29 in October. Current sales dropped two points to 33, six-month expectations fell five points to 32, and prospective buyer foot traffic dropped five points to 18. To spur demand, 43% of builders reduced prices with an average discount of 6%, while 65% offered sales incentives.
Read the full report →Q3 2026: rents post their first yearly gain since mid-2025
as of October 2026
Average rents rose about 0.9% from a year earlier, to roughly $1,915, the first yearly gain since the middle of 2025. Occupancy held at 95.4%. Renters took about 305,000 units over the past year while builders finished about 318,000, the smallest gap since 2015. RealPage expects rents to grow about 2.4% over the next year.
Read the full report →The starter home is out of reach for the typical family
as of October 2026
A family now needs about $126,000 a year to comfortably buy the median home, while the median household earns about $86,000. That 47% gap is wider than at the 2006 bubble peak. First-time buyers made up a record-low 21% of purchases, and their median age is now 40. People who cannot buy keep renting, which supports apartment demand.
Read the full report →Existing-Home Sales Rose 1.5% in September Amid Slower Overall Momentum
as of September 2026
Existing-home sales rose 1.5% from the prior month, even though transactions dropped year over year across all four major regions. Despite this slight monthly pickup, activity remained near the slowest pace seen all year as climbing mortgage rates sidelined potential purchasers. Expanding inventory and extended days on the market are shifting leverage toward buyers, making pricing adjustments and seller concessions increasingly necessary.
Read the full report →U.S. Apartment Market Shows Signs of Tightening
as of September 2026
The national median rent dipped 0.1% in September to $1,388, marking a typical seasonal cooldown. On an annual basis, rents fell 0.4%, showing that price drops continue to moderate as supply gets absorbed. Meanwhile, the apartment vacancy rate dropped to 7%, continuing a steady decline from its earlier peak. Available rentals took an average of 34 days to lease.
Read the full report →Apartment executives say the market is tightening again
as of July 2026
Apartment executives say the market got tighter for the first time in a year, meaning less vacancy and stronger rent growth. The survey's tightness index came in at 57, where anything above 50 means tighter. Construction underway nationally is down about half from 2022, and the Sun Belt is still absorbing its oversupply.
Read the full report →Video
Trends on video
Recent clips from top real estate channels.

Top 10 Affordable Housing Markets in America Right Now

Anthropic's compute landlord, the mines nobody built, and a $6.3 billion heist | Market Hang

7.24% Mortgage Rates: Why the Housing "Lock-In" is Slowly Breaking

How AI Is Changing the Value of a Real Estate Agent

Are Homebuyers Finally Gaining Leverage? | Weekly Housing Outlook

Why Celebrity Clients Trust Victoria Hagan With Their Homes | Built Different
Location Magic
Location Magic tools
Neal's spreadsheets and rules for comparing cities and markets.
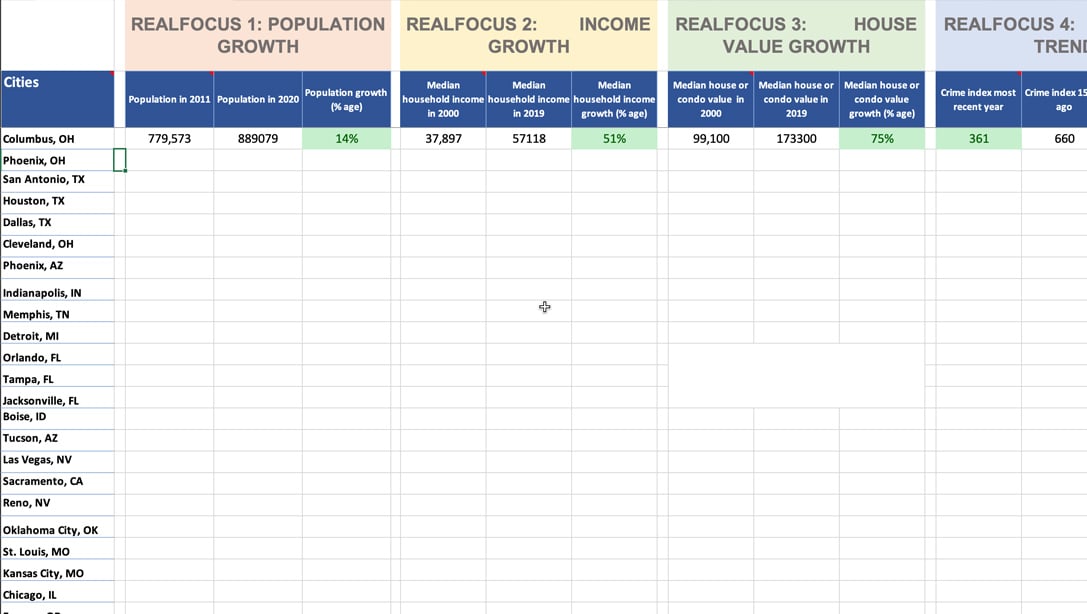
City Comparison Location Magic Spreadsheet
Download Spreadsheet
RealFocus Cheatsheet for Cities: Rules for 2026
Access PDFWebinars
Recent webinars
Replays and upcoming sessions from MultifamilyU.

AI in Real Estate 20 Live Demos. 0 Slides.

The CPA Succession Opportunity
The Water Gold Rush

Is This Rock Bottom Data-Driven Insights and Analysis on the Commercial Real Estate Tipping Point

Bracing for the Storm: Navigating the Looming Crisis in Multifamily and Commercial Real Estate

The Ultimate Guide to Short-Term Rental Success Thriving in Today’s Real Estate Market
Podcast
On the podcast
The newest Multifamily University episodes and Neal's guest appearances.
"Stop Typing to AI": Building a 24/7 Autonomous Enterprise
Smarter Real Estate Investing Through AI with Neal Bawa
Investing by Gut Feeling? Why Data Beats It “by a Million Miles” with Neal Bawa
AI in Real Estate Investing: How Neal Bawa Automates Underwriting
Why There Are No Great Markets, Only Great Timing
Building A $436M Multifamily Portfolio After A Business Exit
The $436M AI Playbook: How Agentic AI is Revolutionizing Real Estate & White-Collar Business Operations
Operating a SMARTER Investment Portfolio With AI
Connect
Join the community
Meet in person or follow along online.
MultifamilyU Meetup network
MultifamilyU runs the nation's premier meetup network for apartment and commercial real estate investors: monthly meetings, strong speakers and practical education. Find a chapter near you.
Find a meetupReport summaries are our own words. Video, webinar and report titles link to their publishers, who own all rights to them. National data only. Refreshed every month.